
Browse our Notebooks
Example computational notebooks that use different libraries pre-installed in Noteable, which can be used as templates for classes and inspiration for your own pieces of code.
Notebooks provide examples of how to use particular subject-specific libraries and analyse representative data to create visualisations, tables and graphs.
The "View Notebook" will allow you to see the notebook on GitHub (but not run it). Use "Right-Click, Save-As" to download a copy. (All these notebooks are released under the BSD 3-clause License)
- Notebooks for Higher Education
- Notebooks for Schools
Notebooks for Higher Education
The notebooks in this section have been designed for a higher education audience. You can see information about the notebook and access it for use with Noteable.
GeoScience
Notebooks focused on the GeoScience Notebook.
Seismology Obspy Notebook
Explore the Obspy framework for seismic data. Utilise ipywidgets to make the tutorial interactive.

Ridgemap Notebook
Explores ridge_map, a geospatial library accessing SRTM elevation data. Demonstrates plotting elevation data as ridge maps.
Rasterio & Matplotlib Notebook
Explores the rasterio and matplotlib libraries to visualize Ordnance Survey terrain digital terrain elevation models of the Lake District obtained from EDINA's Digimap service.
EarthPy Notebook
Explore the EarthPy library to visualise Ordnance Survey terrain of the Lake District obtained from EDINA's Digimap service to plot terrain maps with hillshading to make more 3-Dimensional.
Folium Notebook
Explore the Folium library to plot markers, polylines and other vector/raster/HTML visualisations on a base map.
Covid-19 Notebook
Explore the Folium library for making Choropleth maps through a step-by-step guide using Covid-19 data from John Hopkins University.
KeplerGl Notebook
Explore the KeplerGl interface embedded in a Jupyter map, to create map layers of the global population and GDP.
Language and Machine Learning
Notebooks focused on the Language and Machine Learning Notebook.
Classifications Notebook
Use the base Scipy stack of libraries to visusalise classification-K nearest neighbours (k-NN) and principal component analysis (PCA).
Clustering-k-means Notebook
Use the base Scipy stack of libraries to visualise Clustering K-means of generated data. Makes use of the bokeh library to make the plots interactive.
K-means Compression Notebook
Use the base Scipy stack of libraries to create image filters, making use of ipywidgets to make the tutorial interactive.
Regression Medical Notebook
Use the base Scipy stack of libraries to perform linear regression on a sample diabetes dataset. Make use of the bokeh library to make the plots interactive.
The R language
Notebooks focused on the R-language Notebook.
(Note that the RStudio notebook does not run .ipynb Notebooks.)
Data Cleaning with R
Explore Data Cleaning and Exploratory Analysis (EDA) with R. Demonstrate a typical data cleaning process using a dataset on breast cancer, sample data included.
Notebooks for Schools
The computational notebooks in this section have been designed for school teachers to use in class and distribute to students.
These notebooks have been developed in line with the Scottish Curriculum for Excellence following the technologies framework that spans across a young person's education.
The Experiences and Outcomes that these notebooks cover from the Scottish curriculum define children's learning and progression in areas including Computing Science, Mathematics and Web Development. These notebooks are suitable for school curricula generally and cover activities for a range of pathways for learners.
Before you access a notebook, you can visit the README file with information on the resources and how to import into Noteable using the Git cloning feature.
Web Development resources for Schools
An introduction to web development using HTML, JavaScript and CSS in the JupyterLab environment with Noteable. A Github repository developed by EDINA contains resources for Scottish schools to use with the Noteable service. The resources focus on web development activities and teaching content for classrooms following the Scottish Curriculum for Excellence.
National 3 Notebooks
The course specification includes core skills to complete for the unit at Information and Communication Technology at SCQF level 3. It is expected that learners will develop broad, generic skills through this unit. The main skills areas identified in the specification are Numeracy: Information handling, Employability, enterprise and citizenship and applying thinking skills.
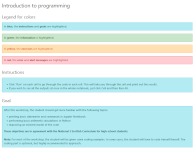
Introduction, part 1
An introductory notebook has been developed to understand the print function and working with variables with assigned values inside the notebook. This notebook also provides an overview of the four main data types on Python – int, float, string and bool. The notebook then distinguishes between = and == on Python for learners.
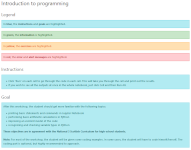
Introduction, part 2
The "Part 2" introductory notebook covers Variable Types, including exercises to explore how variables can have various types. This notebook also explores the four main data types in Python – strings, Booleans, floats and integers.
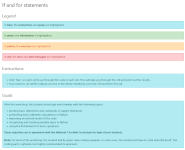
An introduction to if statements in Python
This notebook explores if operations, and includes elif and else operators too.
An introduction to for loops in Python
This notebook explores creating for loops, to do repetitive tasks over a series of items.
An introduction to while loops in Python
This notebook explores creating while loops, to do a repetitive task until a condition is met.
An introduction to Python arrays
Introducing python arrays.
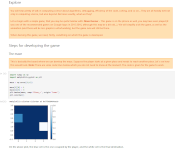
Maze Runner
A notebook (plus images) that explore some slightly more complex coding issues.
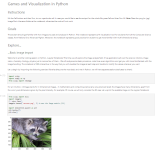
Raccoon Notebook
A notebook (plus images) that explores some interesting things one can do with images.
National 4 Notebooks
The notebook activities in this section have been designed in accordance with learning outcomes at level 4 of the Scottish curriculum. The course specification includes core skills to complete for the ICT unit is a progression from the National 3 set of notebooks and the relevant experiences and outcomes.
Further if statements in Python
This notebook explores if operations, and includes elif and else operators too.
Further for loops in Python
This notebook explores creating for loops, to do repetitive tasks over a series of items.
Further while loops in Python
This notebook explores creating while loops, to do a repetitive task until a condition is met.
Further Python arrays
Introducing python arrays.
National 5 Notebooks
The notebook activities in this section have been designed in accordance with learning outcomes at level 5 of the Scottish curriculum. The course specification includes core skills to complete for the ICT unit is a progression from the National 4 set of notebooks and the relevant experiences and outcomes.
More on if statements in Python
This notebook explores if operations, and includes elif and else operators too.
More on while loops in Python
This notebook explores creating while loops, to do a repetitive task until a condition is met.
More on Python arrays
Introducing python arrays.
National Higher Notebooks
The notebook activities in this section have been designed in accordance with learning outcomes at Higher level of the Scottish curriculum. The course specification includes core skills to complete for the ICT unit is a progression from the National 5 set of notebooks and the relevant experiences and outcomes.
Even more if statements in Python
This notebook explores if operations, and includes elif and else operators too.
Even more while loops in Python
This notebook explores creating while loops, to do a repetitive task until a condition is met.
Even more Python arrays
Introducing python arrays.
Encryption and decryption, part 1
This notebook explores ways of sending a hidden message or code, and deciphering it.
Encryption and decryption, part 2
More complex cyphering and encoding/decoding strings.
Advanced Higher Notebooks
The notebook activities in this section have been designed in accordance with learning outcomes at Advanced Higher level of the Scottish curriculum. The course specification includes core skills to complete for the ICT unit is a progression from the "Higher" set of notebooks and the relevant experiences and outcomes.
if statements in Python
This notebook explores if operations, and includes elif and else operators too.
while loops in Python
This notebook explores creating while loops, to do a repetitive task until a condition is met.
Python arrays
Introducing python arrays.